Three Latino majority zip codes in Cicero, Berwyn, and Melrose Park are in the top 15 zip codes infected in the suburban area. Act! Stay home, avoid groups, mask up, wash your hands.
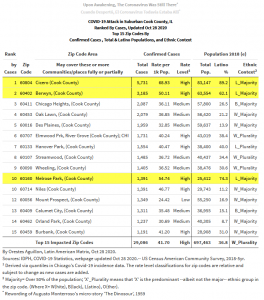
Three Latino majority zip codes in Cicero, Berwyn, and Melrose Park are in the top 15 zip codes infected in the suburban area. Act! Stay home, avoid groups, mask up, wash your hands.

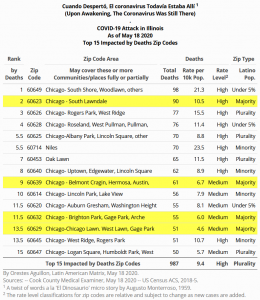
Deaths. May 18 2020, Illinois coronavirus attack update: Four of the top 15 zip codes in the state reporting Covid-19 deaths are Latino Majority zip codes in Chicago. Others are Black, White, and mixed zip codes. Lincoln Park and Niles, are listed, too. #Latinx #COVID19 #Chicago
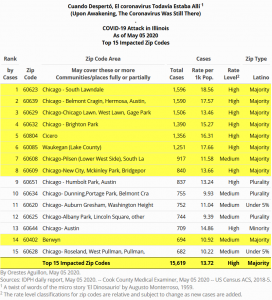
As of today, ten of the top 15 zip codes in the state reporting covid-19 cases are Latino majority zip codes.
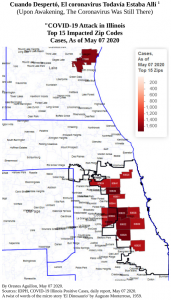
As of May 5, 2020, the top 8 zip codes with coronavirus cases in Illinois are in Latino majority zip codes. They are mostly located in Chicago, but Waukegan and Cicero are in the list, too. Berwyn is in the top 15.
Sophie Cruz, a five year-old daughter of undocumented Mexican immigrants, boldly handed Pope’s Francis a simple drawing depicting complex social themes, spanning immigrant issues that are hundreds of years old.
The drawing’s caption reads:
“My little friends and I love each other
regardless of the color of our skin.”
If you are on deck for delivering a presentation comparing Latino populations in the U.S. — and quickly need to find a good slide-image to drive your points across — you can now download a sample of our Latino Population cartograms. With it, you can compare and contrast the magnitude of Latino populations in the U.S. in ways that are more memorable and informative.
For formal presentations, such as for conferences and panel discussions, download the slide-optimized version of the image shown below at: http://latinamericanmatrix.com/state/4099115009-1.html
——
Likewise, for informal presentations, such as for classrooms, interactive trainings and brainstorming meetings, download the slide-optimized version of the image shown below at: http://latinamericanmatrix.com/state/4099115011-1.html
—–
By the way, these cartograms are also available in Spanish and/or in PDF format.
Have a great presentation!
——
P.S.: If you need custom-made cartograms for your next presentations, please contact us. We can craft cartograms for any possible socio-demographic trait, and for any possible geographic area. We can process raw data from public data sources (such as the U.S. Census) or from your own data-sources (such as your clients’ database.)
Let us be part of your next speech preparation team!
If you like Latin dancing, don’t miss Danzón , a free movie that will be shown as part of the International Film Festival in Chicago on August 13th, 2014. Danzón is one of the ancestors of Salsa. The movie is about adult puppy love –but not for another person– but for the act of dancing. See “events” for details.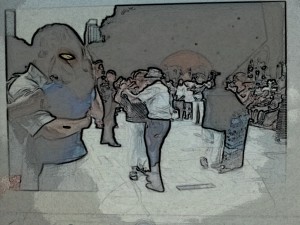
Germans and Argentinians clash tomorrow, July 13, in the 2014 World Cup. Let’s assume that most Latinos are cheering for Argentina. In the US, there is a combined estimated population of 98,335,232 of persons of Latino or German ancestry. Latinos account for 51.7 percent of this population and Germans account for 47 percent. Most will have no problem choosing which team to support. But there are about 1,394,710 persons (1.4 percent) who claim both Latino and German ancestry. What will they choose, tango or oom-pah?
You can now download a map showing the percentages of non-citizens who lack health insurance coverage in Chicago. If you need geocoding services to plan and monitor your outreach campaigns –or assistance in conducting needs assessments– please let us know.
The map is based on the US Census’s ACS 5-Year-Estimates, 2008-2012. Downloadable files are in PDF format, printable to letter-sized paper. (The non-citizen population includes legal residents, undocumented persons, refugees, or any other persons who are not citizens by birth or naturalization.)
To download the maps, go to our store and, in the search area enter “ACS” or “health insurance”,
Or click on the image, below.
If you are running for pubic office in Illinois –particularly in the Chicago metropolitan area– you can now download political geography maps drawn at the block level showing Latino population percentages in key Illinois House districts, Illinois Senate districts, US Congress districts, and Chicago Wards. If you need geocoding services to plan and monitor your voter outreach campaigns, please let us know.
All maps show approved redistricting plans based on the US 2010 Census. Downloadable files are in PDF format, printable to letter-sized paper. To download the maps, go to our store and, in the search area enter “Chicago wards”, “ward 26”, “senate 1”, etc.
Or, for CHICAGO WARDS, click on the image below:
Or, for ILLINOIS HOUSE DISTRICTS, click on the image below:
Or, for ILLINOIS SENATE DISTRICTS, click on the image below:
Or, for Illinois' US CONGRESS districts, click on the image below:
Recent Comments